 IST,
IST,
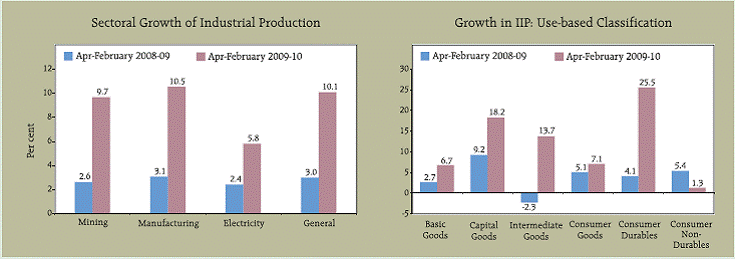
28. Group - Wise Index Numbers of Industrial Production (Base : 1993-94 = 100)
Sr. No. |
Industry |
Weight |
Annual |
Cumulative |
Monthly |
||||
2006-07 |
2007-08 |
2008-09 |
April-February |
February |
|||||
2008-09 |
2009-10 P |
2009 |
2010 P |
||||||
1 |
2 |
3 |
4 |
5 |
6 |
7 |
8 |
9 |
10 |
|
General Index |
100.00 |
247.1 |
268.0 |
275.4 |
272.6 |
300.1 |
276.8 |
318.5 |
I. |
Sectoral Classification |
|
|
|
|
|
|
|
|
1 |
Mining and Quarrying |
10.47 |
163.2 |
171.6 |
176.0 |
172.9 |
189.6 |
183.2 |
205.5 |
2 |
Manufacturing |
79.36 |
263.5 |
287.2 |
295.1 |
292.2 |
323.0 |
297.4 |
345.1 |
3 |
Electricity |
10.17 |
204.7 |
217.7 |
223.7 |
222.1 |
235.0 |
212.7 |
227.0 |
II. |
Use-Based Classification |
|
|
|
|
|
|
|
|
1 |
Basic Goods |
35.57 |
209.3 |
223.9 |
229.7 |
227.8 |
243.1 |
226.2 |
245.1 |
2 |
Capital Goods |
9.26 |
314.2 |
370.8 |
397.9 |
387.8 |
458.4 |
398.9 |
576.1 |
3 |
Intermediate Goods |
26.51 |
242.4 |
264.1 |
259.0 |
256.7 |
291.9 |
251.6 |
290.8 |
4 |
Consumer Goods |
28.66 |
276.8 |
293.6 |
307.5 |
305.6 |
327.2 |
323.3 |
352.0 |
4(a) |
Consumer Durables |
5.36 |
382.0 |
378.0 |
395.0 |
390.6 |
490.2 |
412.9 |
536.3 |
4(b) |
Consumer Non-Durables |
23.30 |
252.6 |
274.2 |
287.3 |
286.0 |
289.7 |
302.7 |
309.6 |
Source : Central Statistical Organisation, Government of India. |
|||||||||
 |
صفحے پر آخری اپ ڈیٹ:


